
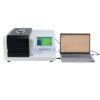
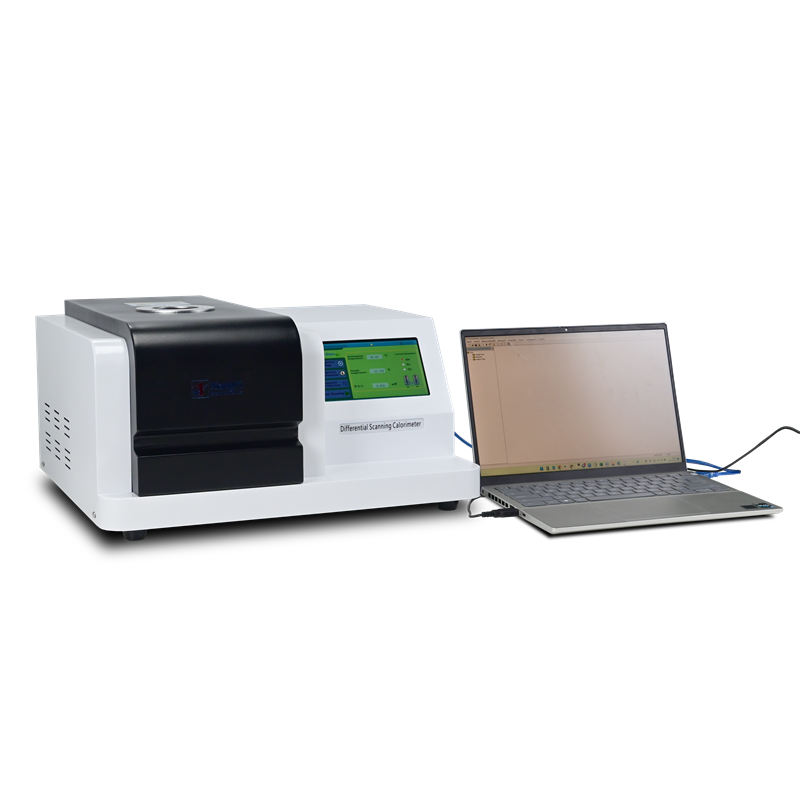
DSC3000 (DSC200/DSC2000) Differential scanning calorimetry (DSC) technology has been widely used. Differential scanning calorimetry is both a routine quality testing tool, but also a research tool. It measures temperature, heat flow relationship related to materials internal thermal transition. Our company’s device is heat flux differential scanning calorimeter, with good repeatability, high accuracy characteristics, especially suitable for accurate measurement of the specific heat.

The device is easy to calibrate, using a low melting point, fast and reliable, and with a wide range of applications, especially in materials research and development, performance testing and quality control. Characteristics of the material, such as the glass transition temperature, cold crystallization, phase transition, melting, crystallization, product stability, the curing / crosslinking, oxidation induction, etc. are research areas of differential scanning calorimeter.
Differential scanning calorimetry applications are: the curing reaction temperature and thermal effects of polymer materials, material phase change temperature and its thermal effects measurement, polymer materials crystallization, melting temperature and its thermal effects measurement, the glass transition temperature of the polymer material and so on. Subjects of experiment are: solid, liquid, viscous samples, except the gas.
Place the specimen and the reference material into the crucibles respectively, heating in the oven to change the temperature of the specimen and the reference material. If hot melt of the specimen as same as the reference material and the specimen has not the thermal effect, the temperature difference between the two is close to “0”, then we can get a smooth curve.
As the temperature increases, the specimen produces a thermal effect, but the reference material doesn’t produce the thermal effect, it makes the temperature difference between the two, it expresses as the peak in the DTA curve, the bigger temperature difference, the greater the peak, and the more the change number of temperature difference, the more the number of peaks. It is called peak exothermic which peak upward, and it is called peak endothermic which peak downward.
Performance advantages
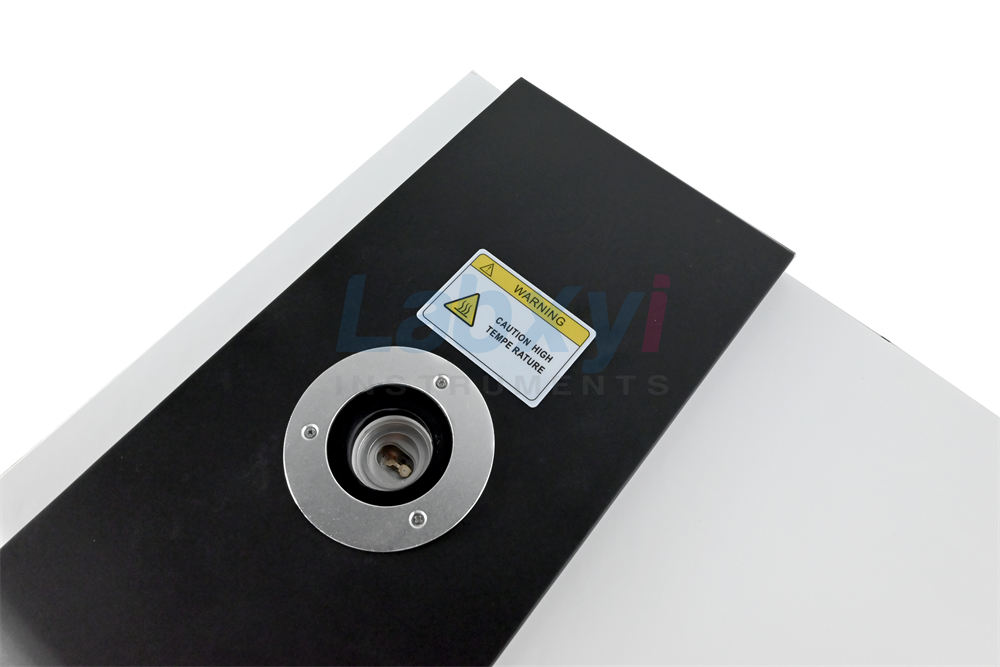
- Brand new furnace structure, better resolution and resolution, and better baseline stability instrument main control chip.
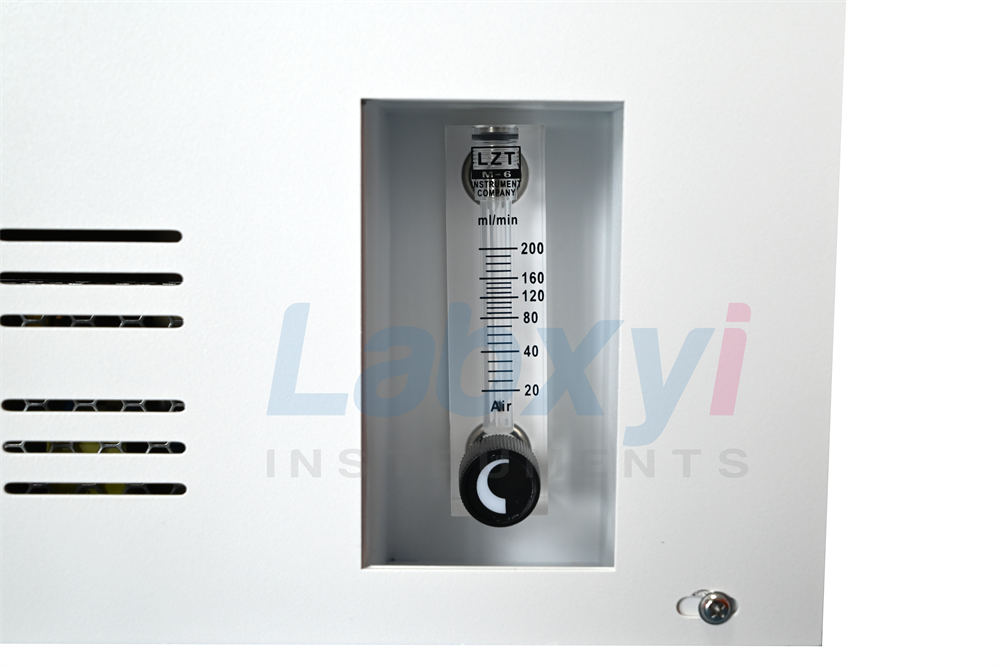
- Digital gas flow meter controls the flow of purge gas, and the data is directly recorded in the database.
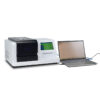
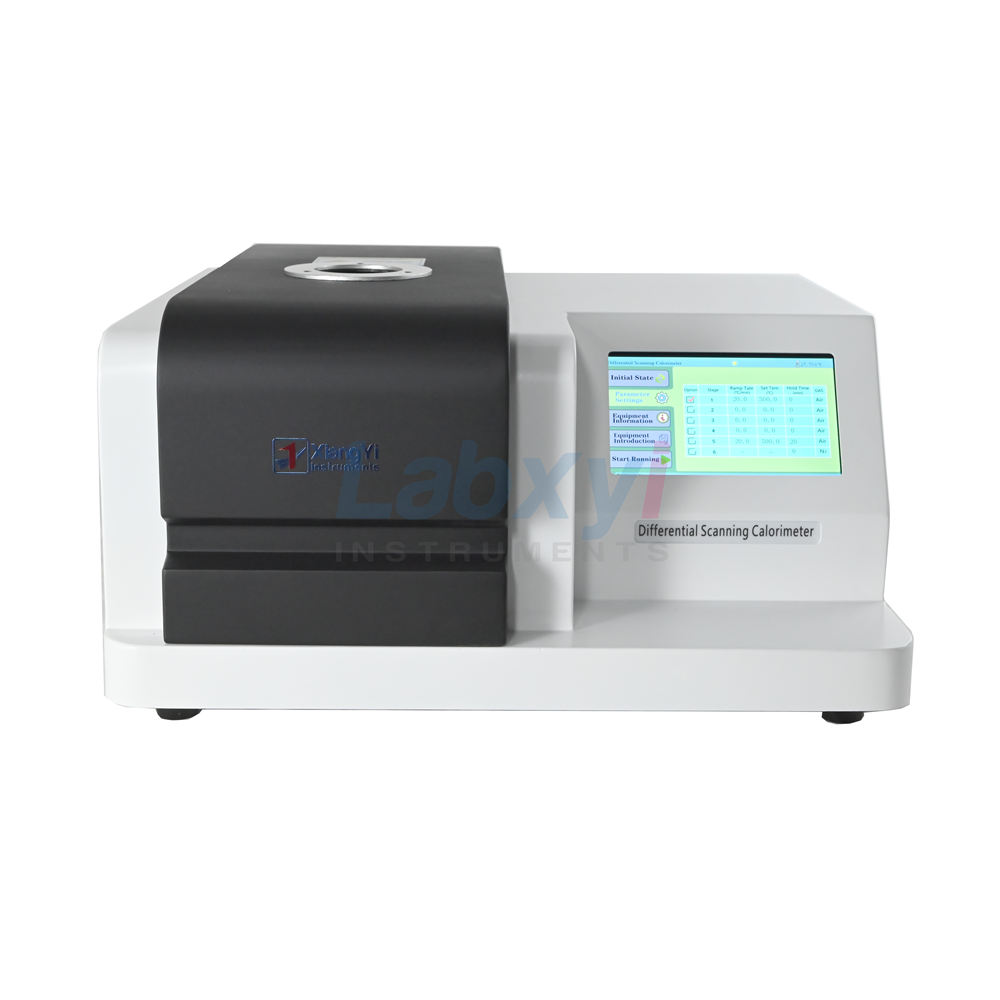
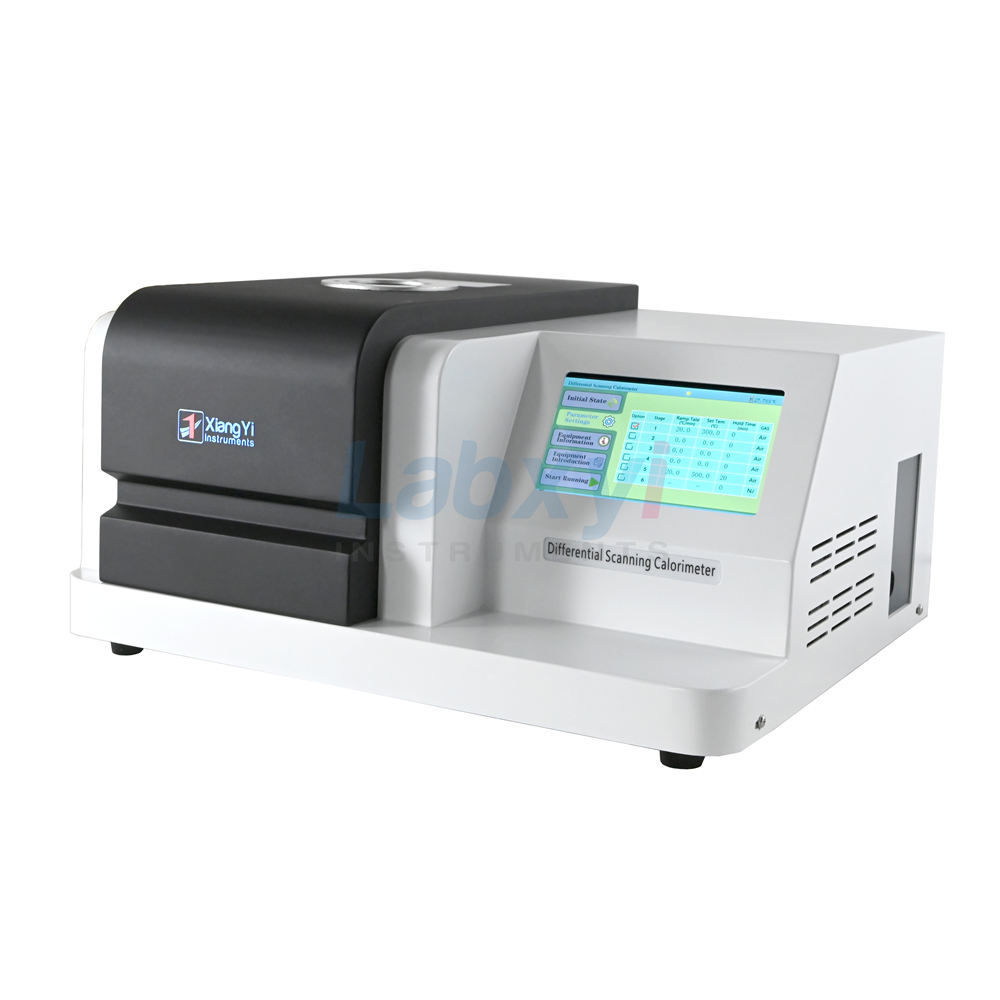
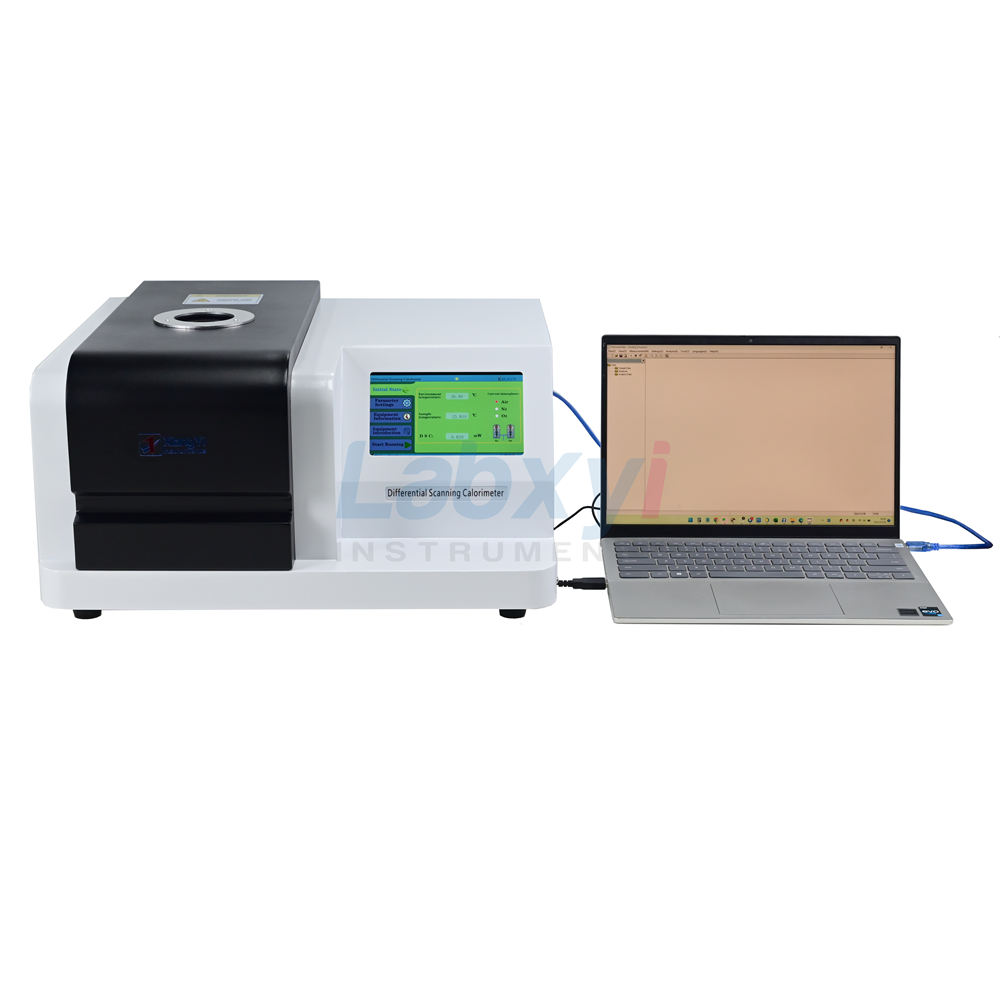
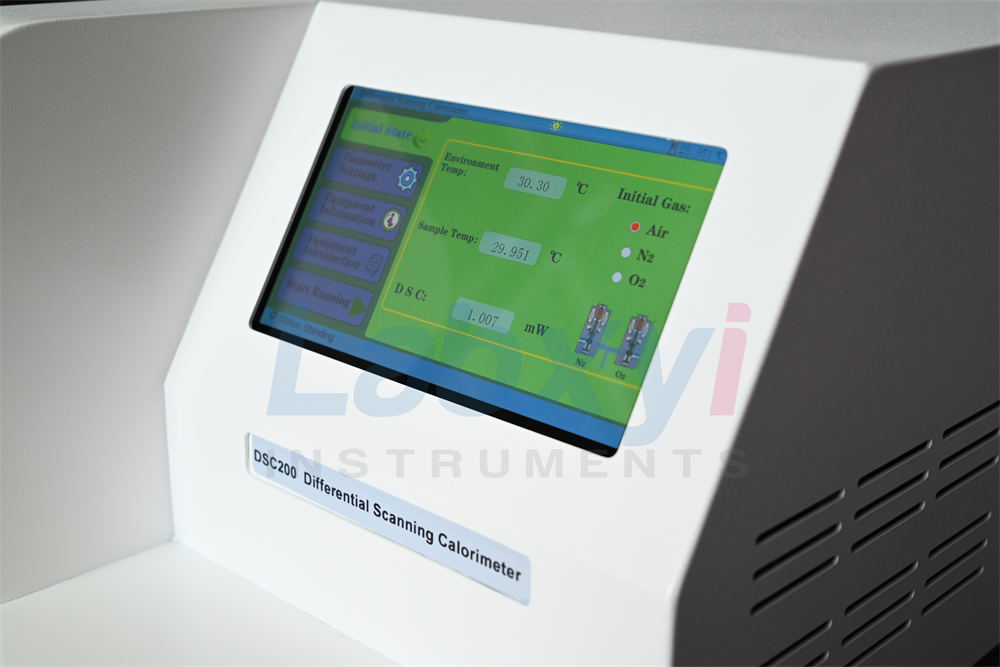
- The instrument can adopt two-way control (host control, software control), friendly interface and easy operation.
- Using the Cortex-M3 core ARM controller, the operation processing speed is faster and the temperature control is more stable.
- Using USB two-way communication, the operation is more convenient.
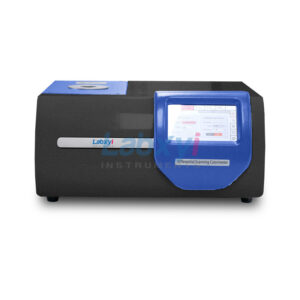
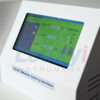
- Adopt 7-inch 24bit color full-color LCD touch screen, the interface is more friendly.
- Adopt professional alloy sensor, which is more ant i-corrosion and anti-oxidation.
Experimental principle
Materials are often accompanied by thermal effects in the process of physical changes and chemical changes, exothermic and endothermic phenomena reflect the heat enthalpy of the material has changed. DTA can measure the functional relationship of temperature difference between the specimen and the reference material to temperature or time in the same heating conditions.
Differential scanning calorimetry is a technique, which in the case of process control temperature, measures the relationship of power difference and temperature between the output material and reference material. Our company’s device is heat flux differential scanning calorimeter, the ordinate is heat flow difference of the sample and the reference material, in units of mw. Abscissa is the time (t) or temperature (T), from left to right for the growth (does not meet this requirement should be specified).
After putting the specimen and the reference material into crucible, according to the heating rate, if the hot melt of the reference material similar as the specimen, we can get the ideal scanning calorimetric analysis diagram.
In this picture, T reflects the temperature curve of thermocouple which sticks in the reference material; Line AH reflects the temperature difference curve between the specimen and the reference material. If the specimen without thermal effects, △T between the specimen and the reference material is 0, line AB, DE, GH is smooth baseline in the curve. When the thermal effect occurs, if the temperature of specimen lowers than the temperature of reference material, we can get the endothermic peak like line BCD; otherwise, we can get the exothermic peak like line EFG.
The number, position, peak area, direction, height, width, symmetry of the peaks reflect the times of physical changes and chemical changes in the measured temperature range, temperature range which changed, the size , positive and negative of thermal effect . The heights, width, symmetry of the peaks are not only relating with test conditions, but also relating with pharmacokinetics factors in the process of the specimen change, the result is much more complex than the ideal curve.
SPECIFICATIONS
| Model | DSC3000 (upgrade of DSC200 & DSC2000) |
| DSC range | 0 ~ ±600mW |
| Temperature range | RT ~ 600 °C |
| Cooled method | Air-cooled |
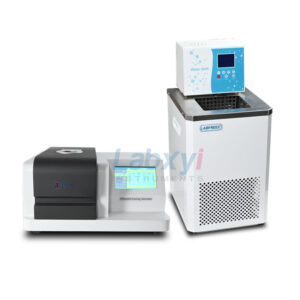
| Semiconductor cooling -40C | Optional |
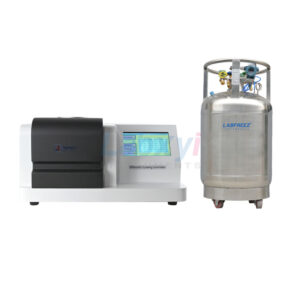
| Liquid nitrogen cooling -150C | Optional |
| Curve scanning | Heating & cooling temp. scan |
| Heating rate | 1 ~ 100 °C /min |
| Cooling rate * | 5 ~ 30 °C /min |
| Temperature resolution | 0.001 °C |
| Temperature fluctuations | ±0.001°C |
| Temperature repeatability | ±0.01°C |
| DSC noise | 0.01μW |
| DSC resolution | 0.01μW |
| DSC accuracy | 0.001mW |
| DSC sensitivity | 0.01μW |
| Temp. Control Mode | Heating, cooling & constant temperature (auto program
control) |
| Temperature sensor | 1 for sample
1 for instrument 1 for furnace |
| Atmosphere gas control | Nitrogen, oxygen Auto switch |
| Gas flow rate | 0-300mL/min |
| Gas pressure | 0.2MPa |
| Display | 24bit 7 inches LCD touch screen |
| Data interface | USB interface |
| Software | Three-in-one operation software, suitable for DSC, TGA, STA connection |
| Parameter standard | equipped with standard material (indium, tin, and lead), user may correct temperature and heat enthalpy |
| Dimensions (L*W*H) | 505*405*155mm |
| Power supply | AC 220V/110V, 50~60Hz |
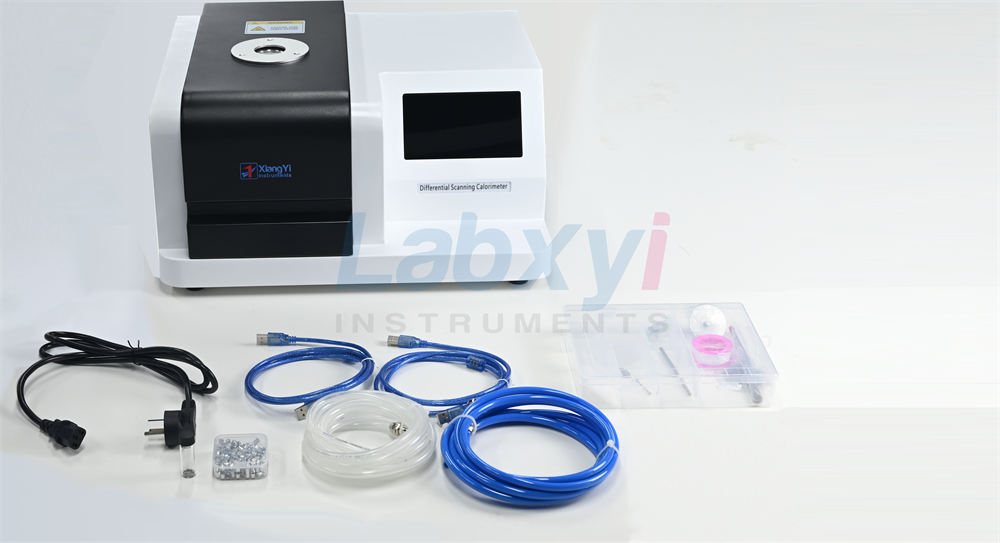
Standard accessories
| ITEM NAME | QTY |
| Host instrument | 1 |
| Soft | 1 |
| Data Line | 1 |
| Power Line | 1 |
| Aluminum crucibles | 200 |
| Bag of pure tin grains | 1 |
| Fuse 10A | 5 |
| Operation manual | 1 |
| Warranty card | 1 |
| Certification | 1 |